This article answers the following queries :
Contents :

- How to perform daily monitoring of Java stack in SAP ?
- What are the daily checks for Java applications of SAP ?
- How to access management console in SAP ?
- How to perform session monitoring in JAVA stack of SAP ?
- How to view various java reports in JAVA stack of SAP?
- What are the various java reports available in Java stack of SAP and what is their significance?
- How to view log and traces in java stack of SAP?
- Where to view default trace in java stack of SAP?
- What is the use of management console in SAP ?
Contents :
- 1. Checking the java stack/portal accessibility
- 2. Actioning, in case portal not accessible
- 3. User load analysis
- 4. Java Reports – Navigation and usability
- 5. Memory consumption and Threads report
- 6. Session Monitoring
- 7. Logs and Traces (Default trace, Server0 log etc)
- 8. Accessing Management Console
- 9. Checking System availability using Management Console(SDM, Msg server, Enqueue server, Java nodes etc)
- 10. Check various logs(work directory logs, jcontrol, default trace, application log etc)
Java Monitoring :
Place the link of the respective java application in the browser and check whether the java application is opening:
For example:
If java is up and running, a screen similar to below will open.
If the page did not open,
i) Check whether there are network issues
ii)
Check tablespaces occupancy levels at Oslevel and make sure sufficient
space is there and if any tablespace is 100% full, action the same
iii) Check the default trace for any critical errors
iv) Check application log to determine any memory related issues
v) Check server node status at oslevel or through management console and action and bring up the java again.
To estimate the user load and to check the number of users logged onto the java portal :
Navigate to User Administration -> Activity Reports
i) Check “Number of users in the last 3 hours” report
ii) To figure out most active users,
Check the 10Most active users report
Java Reports :
Java Memory Consumption Report and Threads Reports :
These
reports includes a chart of the memory usage of a cluster node and a
chart related to the system and application thread pool.
To check this report login to nwa of the respective java stack :
Then navigate to Monitoring -> Java System Reports :
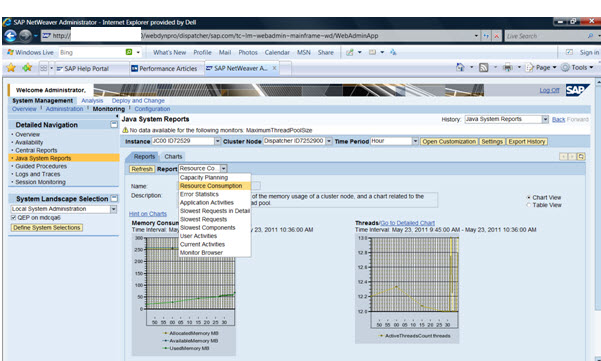
Here following reports can be taken by selecting the respective report from the drop down provided:
- Capacity Planning : This report includes a chart representing the requests sent to J2EE Engine, a chart for the number of http and security sessions, and a chart of the communication between J2EE nodes
- Resource Consumption : This report includes a chart of the memory usage of a cluster node, and a chart related to the system and application thread pool
- Application Activities : This report includes a chart that represents the history of the activities of deployed applications
- Slowest requests
- Slowest components
- User activities
- Current activities

However from monitoring perspective, resource consumption report is most important to analyse the memory consumption.
Select resource consumption from the dropdown to view the memory statistics as below:
Click on Go to Detailed Chart link of the respective report to view detailed chart as below
Click Hint on charts link to analyse the report better.
Select
the respective Instance, Cluster node and Time period from the provided
dropdown boxes to view the reports belonging to the same
Table view for Threads report:
There are 2 types of views: Chart view and Table view. You can change the view by selecting the respective radio button.
Please find below table view for Memory Consumption report
Session Monitoring:
To monitor sessions, navigate to Monitoring -> Session Monitoring
Best regards,
source: scn.sap.com
source: scn.sap.com


This comment has been removed by the author.
ReplyDeleteNice article, its very informative content..thanks for sharing...Waiting for the next update.
ReplyDeleteswift developer course in chennai
swift developer certification training in chennai